Geopandas Geoplot and Shapely
Basic Read and Visualize
import pandas as pd
import geopandas as gpd
from shapely.geometry import Point,Polygon
import numpy as np
import matplotlib.pyplot as plt
import geoplot as gpl
import geoplot.crs as gcrs
from shapely.ops import cascaded_union
dataSA = gpd.read_file(pathSA) # /path/to/geojson
dataSD = dataSA[dataSA['COUNTY']=='SD']
gpl.polyplot(dataSD,figsize=(12, 8))
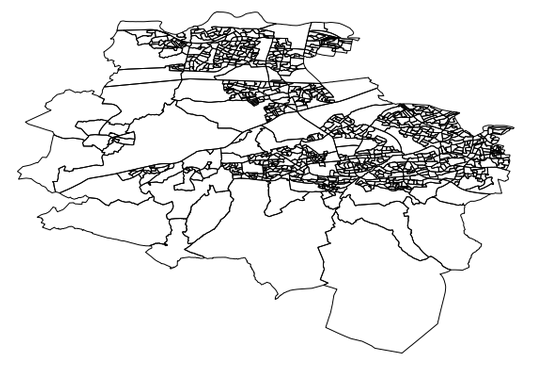
Union of Polygons
bound = gpd.GeoSeries(cascaded_union(list(dataSD['geometry'])))
bound.plot()
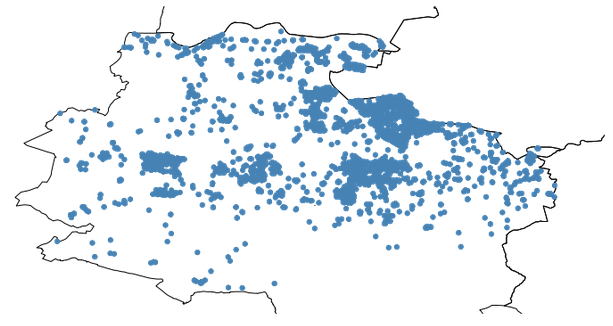
Check if points in polygons
tmpjoin = gpd.sjoin(dataPA,gdf,how='inner',op='contains')
gdfPA = gdf.iloc[list(tmpjoin['index_right'])]
gdfPA['Label'] = list(tmpjoin['Name'])
target = 'SD'
ax = gpl.polyplot(dataC,figsize=(12, 8))
gpl.pointplot(gdfC[gdfC['Label']==target],ax=ax)
References